|
|
ThinkingProcess |
Glossary of terms
 |
Critical to Quality: CTQs are specified by the customer of a process or a service as the things that are particularly important to them with the service or product. |
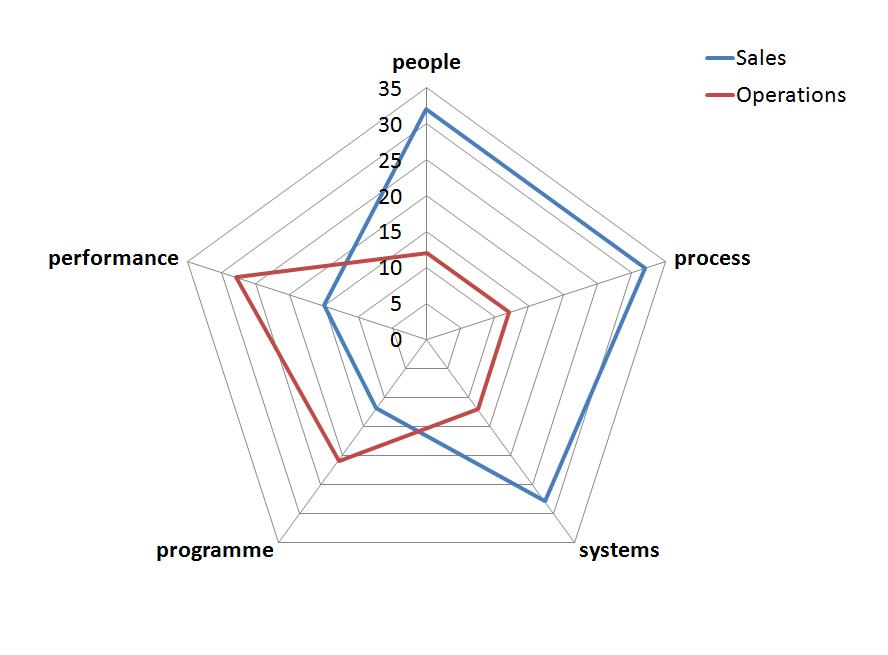 |
Spider Diagram: A spider diagram, or radar chart is a type of graph shown on the left (click to see larger). It can be easily created in Excel to show relative performance of different factors, where the centre of the web is poor and the outside good. |